From The Maven Letter: 8 December 2023
Gold has certainly made some attention-grabbing moves in the last two weeks!
Most attention-grabbing were its drive up through $2000 per oz. two weeks ago and then its spike to a new all-time high of $2140, after which it immediately dropped $100. As all the coverage suggests these two weeks have been frenetic…though really the yellow metal has been laying the groundwork for those moves for some time.
After bottoming at $1820 in early October the yellow metal marched higher, touching $2000 by the end of the month. After relinquishing some of those gains to hit $1938 on November 10th, gold ground its way higher for two weeks to close at $1994 on November 23.
That 6-week setup meant that when it moved above $2000 per oz. and broke that round-number resistance, it had a free path higher: by November 28 it was at $2044. It traded at that level for a few days…and then came the intensity of December 3rd and 4th when gold spiked from $2070 as high as $2138 before heading quickly back down to $2020.
The Sunday spike was short covering. This happens with regularity in markets moving higher quickly: big long players see a chance to squeeze those who are short by pushing the price just high enough that the shorts have to cover.
That’s what happened here. I say it with certainty because (1) there was a big short position in gold and (2) there were no other macro reasons to explain the spike.
Short covering rallies are dramatic (check) and almost always reverse quickly (check). The part that’s a bit annoying is how the price then trended down through Monday, eating away the gains from a week prior.
Gold remained above $2000, which is good (until today – more on that later). I will start to question the potential for this run to carry on right now (through December) if it falls below that round number. On the flip side, if gold establishes $2010 as a new base, that would support the next move higher.
And there are reasons for another move higher, at least according to bond yields.
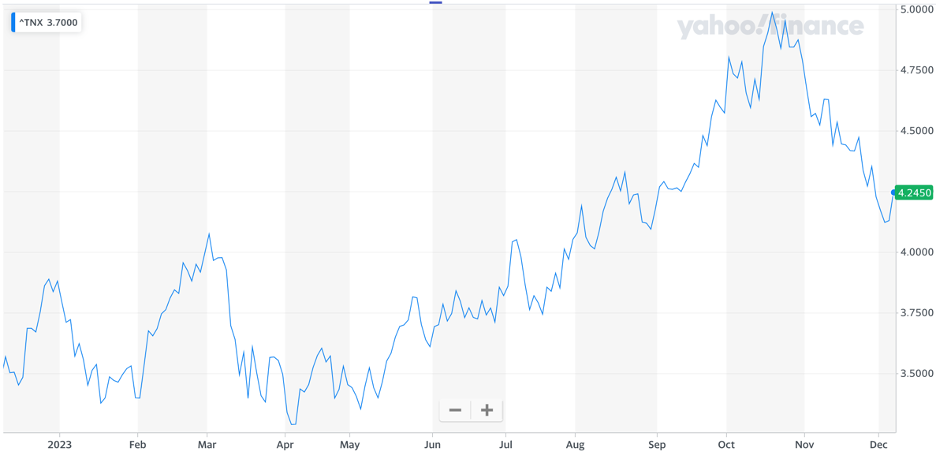
Yields continue to drop. The 10-year peaked in the second half of October at 4.99%. It’s 4.23% today.
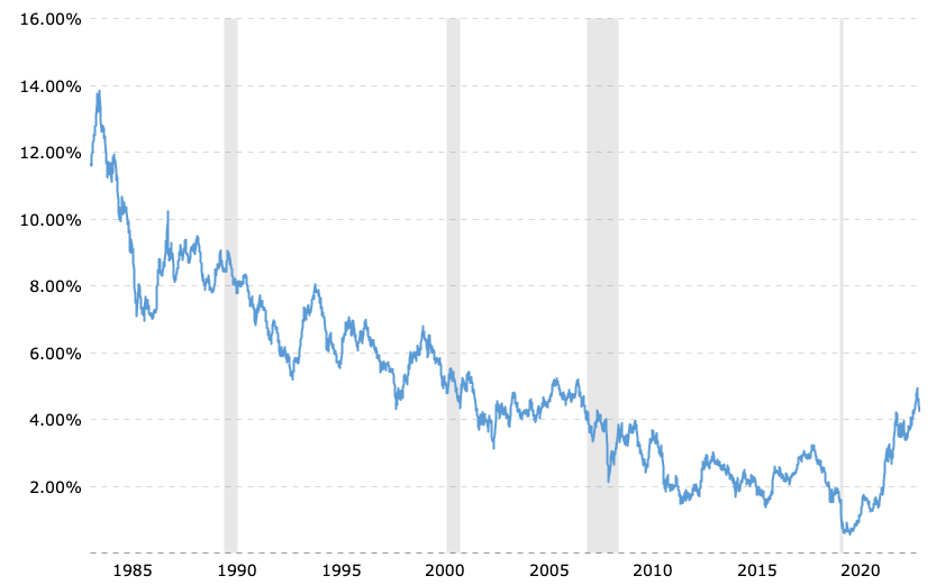
The turn is sharp, to be sure, but a one-year chart doesn’t give any context. I’m just going to throw this long-term chart in for that.
This reminds us that (1) the upturn in yields from 2020 until a month ago changed a downtrend that had been in place for decades and (2) the downshift is still brand new and teeny tiny.
That said, being tiny in long-term context doesn’t diminish the importance of what bonds are doing and saying right now. In a talk last Friday Jerome Powell leaned into his “higher for longer” reminder about rates, but bond traders pointedly ignored him and sent yields down 15 basis points that day.
The shift in mentality on rates is intense. The bond yield curve now suggests five or six 25-basis-point cuts in 2024, a much more aggressive tightening path than the Fed is suggesting.
It would take a recession to warrant that many rate cuts. Yet ‘soft landing’ remains the dominant narrative, which would mean slow but still positive growth and no recession. The Fed may well cut in such a setting if unemployment continues to creep up…but they would not cut five or six times.
To bring this ‘next year’ arm waving closer: traders apparently see a 70% chance the Fed will cut rates in the first quarter of next year. With GDP growth still looking good and unemployment not yet having increased 0.5% year-over-year (Sahm’s rule), there isn’t clear reason to believe that’s what the Fed will do.
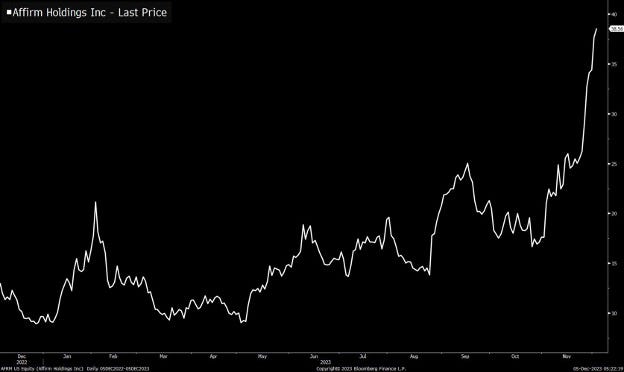
Certainly the stock market went on a tear in November, showing some of the speculative energy we hadn’t seen since 2021. Bitcoin is back above $40,000 again and some meme-retail-easy debt-Robin Hood-type stocks are running. Affirm, a pioneer of Buy Now Pay Later business, is getting all kinds of love.
As has been the case for ages now, the setup is hard to understand. November saw stocks moving higher while bond yields dropped because traders starting expecting rate cuts. That’s a pairing that can make sense at a market top (when forward-looking traders realize the party is about to end). Is that where we are today, at the top of this the-economy-didn’t-break-despite-historic-rate-hikes good period and about to dip into bad and need central bank support? If so, rate cuts and gold for everyone.
Or are things actually OK? If so, bond yields may have overcorrected.
We saw one bit of insight into this question today, with the November jobs report. The US economy added more new jobs than expected (199,000 vs 185,000 forecast) and the unemployment rate dropped to 3.7%, below all forecasts. Meanwhile the participation rate ticked up slightly to 62.8% and weekly hours also rose.
Now, there was a boost from 30,000 auto workers and 17,000 Hollywood workers returning from their picket lines. Analysts knew to expect those, but they still strengthen the numbers. Either way, it’s a strong-economy report, not one that suggests the need to cut rates imminently or significantly.
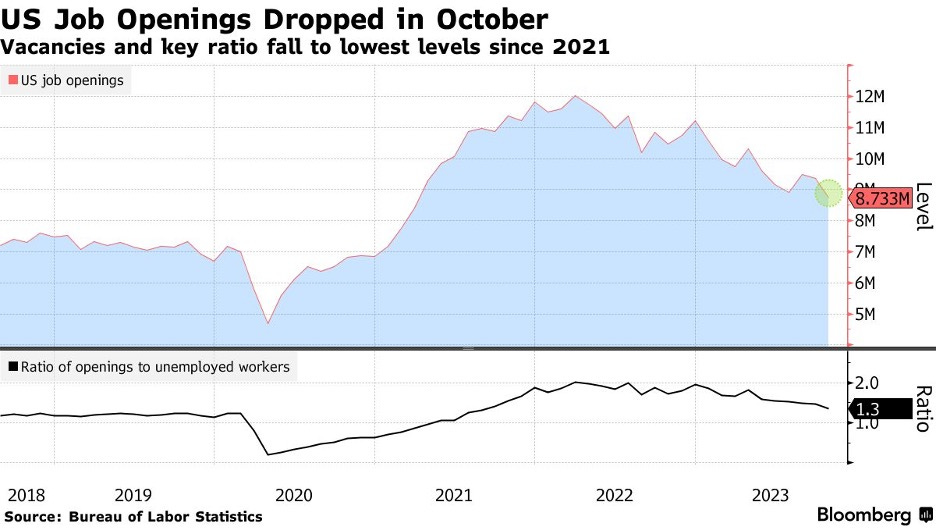
Tuesday’s Job Openings and Labor Turnover Survey sent the same message. Available positions decreased to 8.7 million from a downwardly-revised 9.4 million the month before, a result below all analysts estimates. And the decline in job openings was broad, cutting across all sectors.
We also saw the November ISM Services report on Tuesday, which showed continued modest expansion in the services sector while a metric of prices paid by service providers dropped to a four-month low. Together, the reports suggest that both sides of the Fed’s mandate – employment and price stability – are moving in the right direction. A tight labor market amplifies inflation as employers pay more to retain employees, who then spend more. That setup, which persisted through 2022, has now abated; labor supply and demand are reasonably in balance, helping inflation to continue easing.
What do we want to see in the upcoming data? In this good-is-good-but-also-bad setup, there’s no simple way to read the readings. Weak jobs data supports the potential for rate cuts, which is what the market seems to want…but too-weak data risks recession, which isn’t desired. Strong data supports a good economy, which should be good for stocks…but is bad for rate cuts.
So…be careful what you wish for, cause you just might get it?
Bottom line: bond yields had fallen significantly as traders priced in an aggressive rate cut cycle next year. Today’s jobs report adds to questions about whether that prediction is warranted. Five or six cuts only makes sense if we head into a recession, yet it looks like we’re on track for a soft landing.
I do want to take a moment to remember that the market has been terrible at predicting the Fed Funds rate, assuming more hikes sooner when the rate was a 0 from 2010 to 2016, then underestimating the scale and duration of hiking cycles. It would fit the pattern for the market to be over-estimating rate cuts today.
As for gold…it didn’t like today’s jobs report, dropping from $2030 to $1994 per oz. But as of writing it is clawing its way back up and just got back above $2000, on a Friday afternoon to boot.
If traders step back their rate cut forecasts and yields rise, gold will feel the pressure. But it has an insanely strong chart right now. Barring a dramatic change in yield expectations, I would guess the yellow metal trades sideways here for a while, demonstrating that $2000 is a new support rather than resistance level. As long as it stays above $2000, the chart looks very strong and suggests the next move should be higher.


